
Visualize a fitted fit_dd_choice() model. For a structural fit,
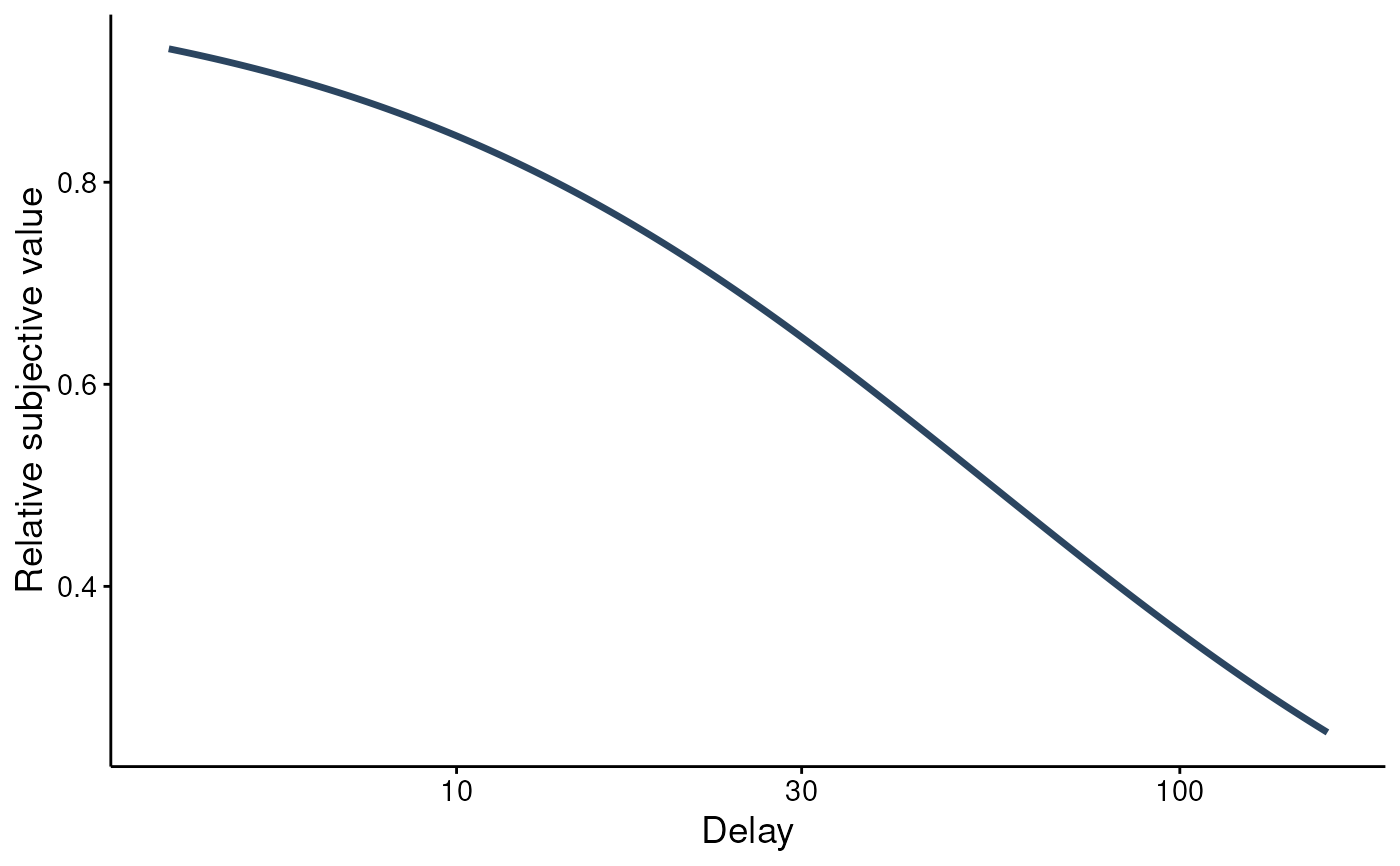
type = "population" (default) draws the implied discount curve from the
estimated discount rate, type = "individual" adds the per-subject curves,
and type = "parameters" shows the subject-k distribution. For both
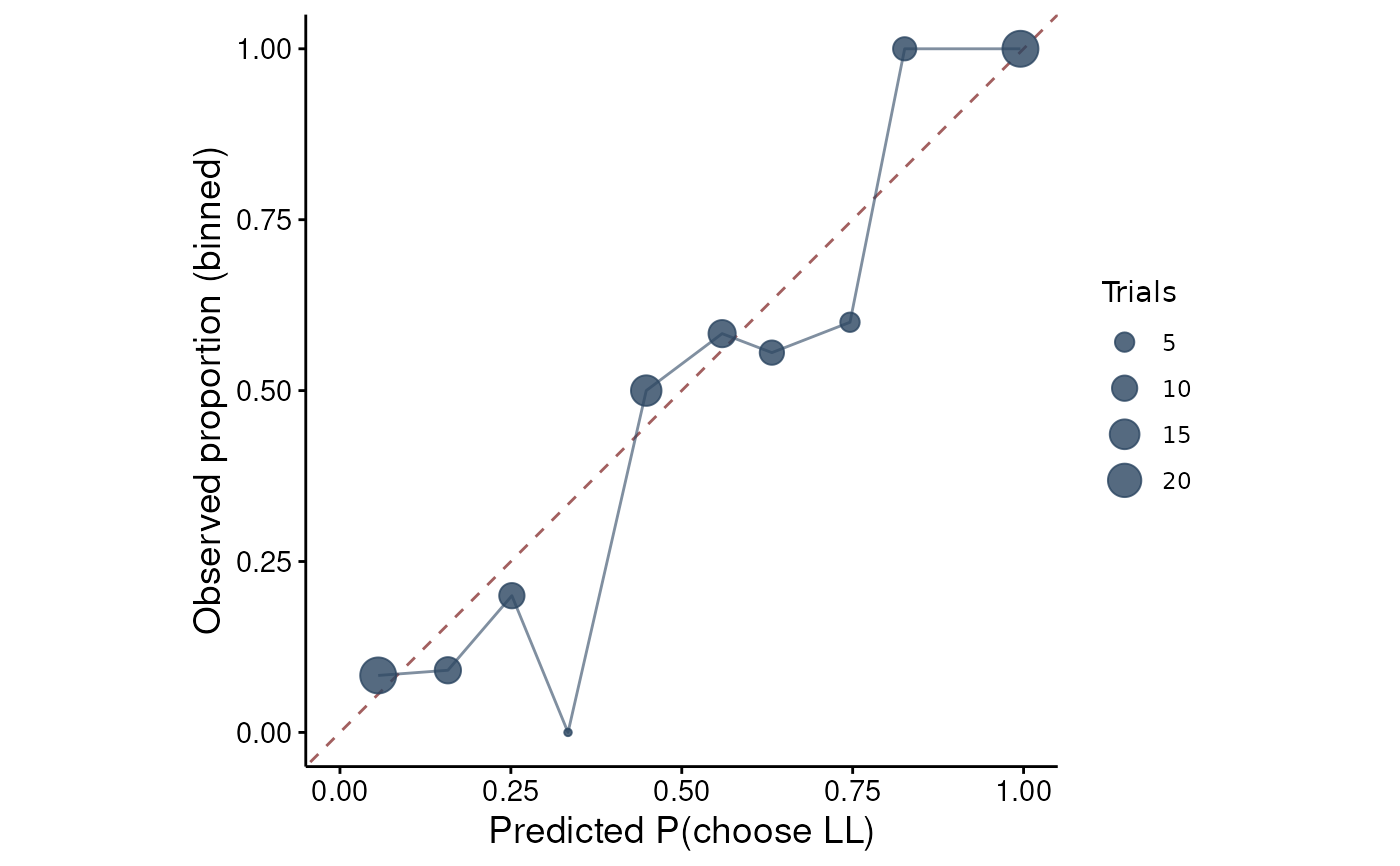
structural and descriptive (Young 2018) fits, type = "calibration" plots
the observed choice proportion against the fitted P(choose LL), binned by
fitted probability (a likelihood-geometry-agnostic goodness-of-fit view).
Descriptive fits have no structural discount rate, so the curve/parameter
types are unavailable.
Arguments
- x
A
beezdiscounting_choiceobject.- type
One of
"population","individual","calibration","parameters". Defaults to"population"(structural) or"calibration"(descriptive).- ids
Optional subset of subject ids for
type = "individual".- at
Optional named list conditioning the curve on factor levels / covariate values.
- n_points
Number of delay points in the curve grid.
- x_trans
Delay-axis scale:
"log10"(default) or"linear".- show_observed
Unused for the implied discount curve (kept for a consistent signature across tiers).
- ...
Unused.
Value
A ggplot2::ggplot object.
Examples
# \donttest{
ch <- simulate_dd_choice(n_subjects = 12, seed = 1)
fit <- fit_dd_choice(ch, equation = "mazur")
plot(fit)
 plot(fit, type = "calibration")
 # }
# }