
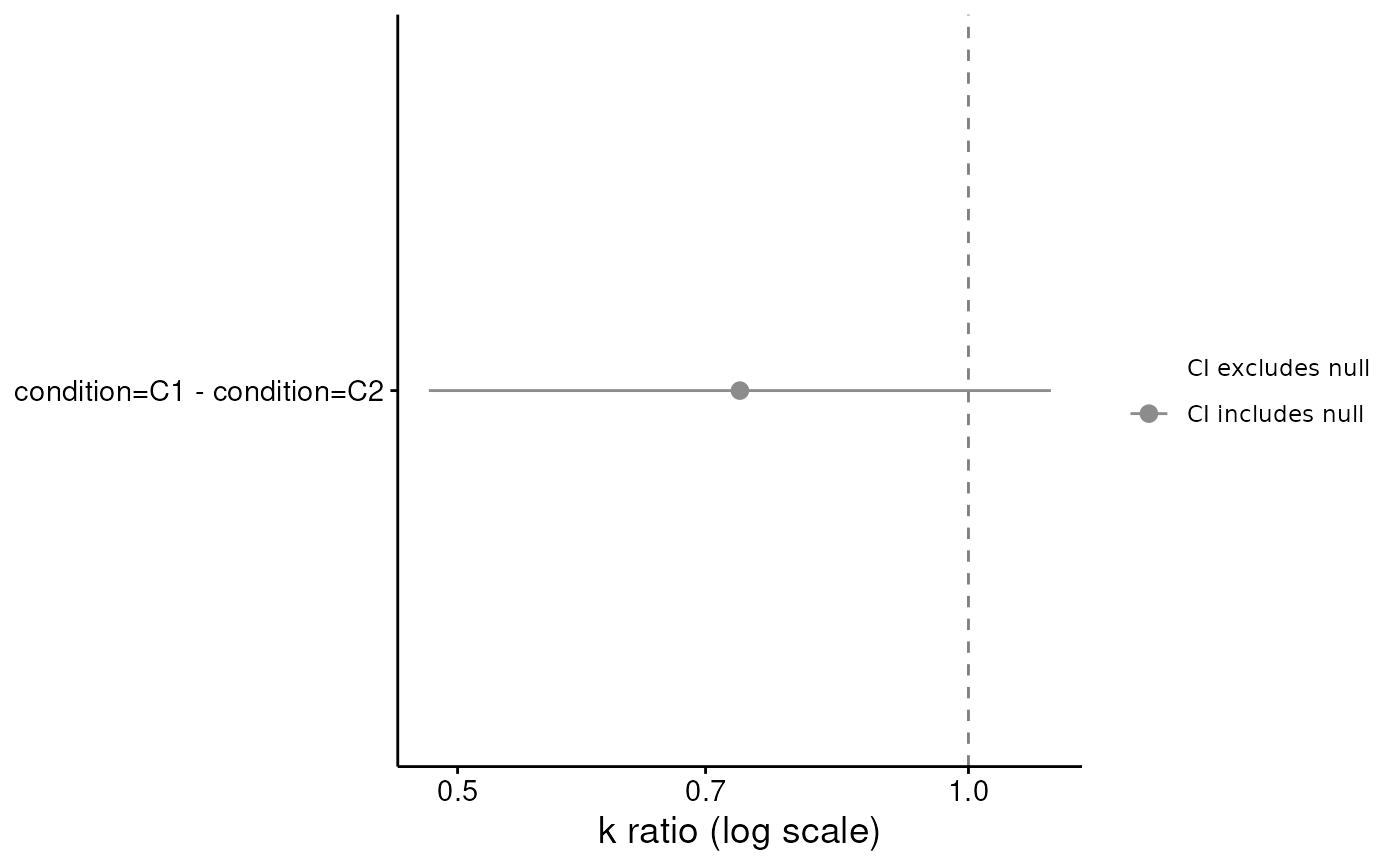
Forest plot of the pairwise (or treatment-vs-control) contrasts from
get_dd_comparisons(). type = "ratio" (default) shows each k ratio on a
log axis with a reference line at 1; type = "difference" shows the
difference in log10 k with a reference line at 0. A contrast is flagged when
its interval excludes the null (a backend-agnostic rule that applies to
both the frequentist (TMB) and Bayesian (brms) backends).
Value
A ggplot2::ggplot object.
Examples
# \donttest{
sim <- simulate_dd_ip(n_subjects = 30, n_conditions = 2, delta_k = c(0, 0.5), seed = 1)
fit <- fit_dd_tmb(sim, equation = "mazur", factors = "condition")
#> Fitting TMB mixed-effects discounting model (mazur, sltb)...
#> Subjects: 30, Observations: 210
#> Multi-start: best NLL = -339.65 (start set 1 of 3)
#> Converged (NLL = -339.65). Done.
cmp <- get_dd_comparisons(fit)
plot(cmp)
 # }
# }