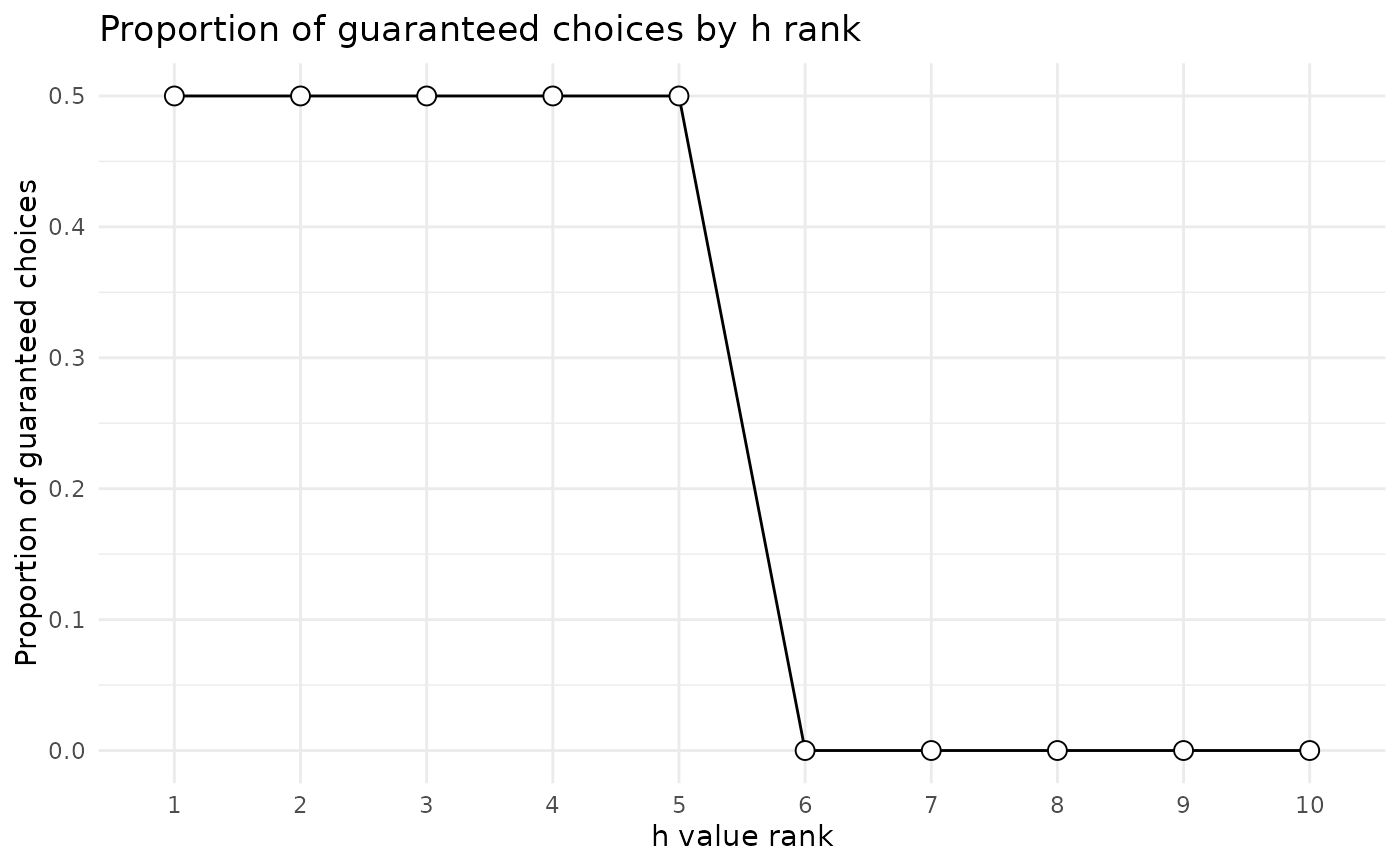
Plot Proportion of Guaranteed Choices by h Rank
Usage
# S3 method for class 'prop_sc_output'
plot(
  x,
  ...,
  pt_shape = 21,
  pt_fill = "white",
  pt_size = 3,
  title = "Proportion of guaranteed choices by h rank",
  xlab = "h value rank",
  ylab = "Proportion of guaranteed choices"
)
Arguments
- x
Output from the
prop_scfunction- ...
Additional arguments passed to
ggplot2::geom_point()- pt_shape
Shape of the points in the plot. Default is 21.
- pt_fill
Fill color of the points in the plot. Default is "white".
- pt_size
Size of the points in the plot. Default is 3.
- title
Title of the plot.
- xlab
Label for the x-axis. Default is "h value rank".
- ylab
Label for the y-axis.