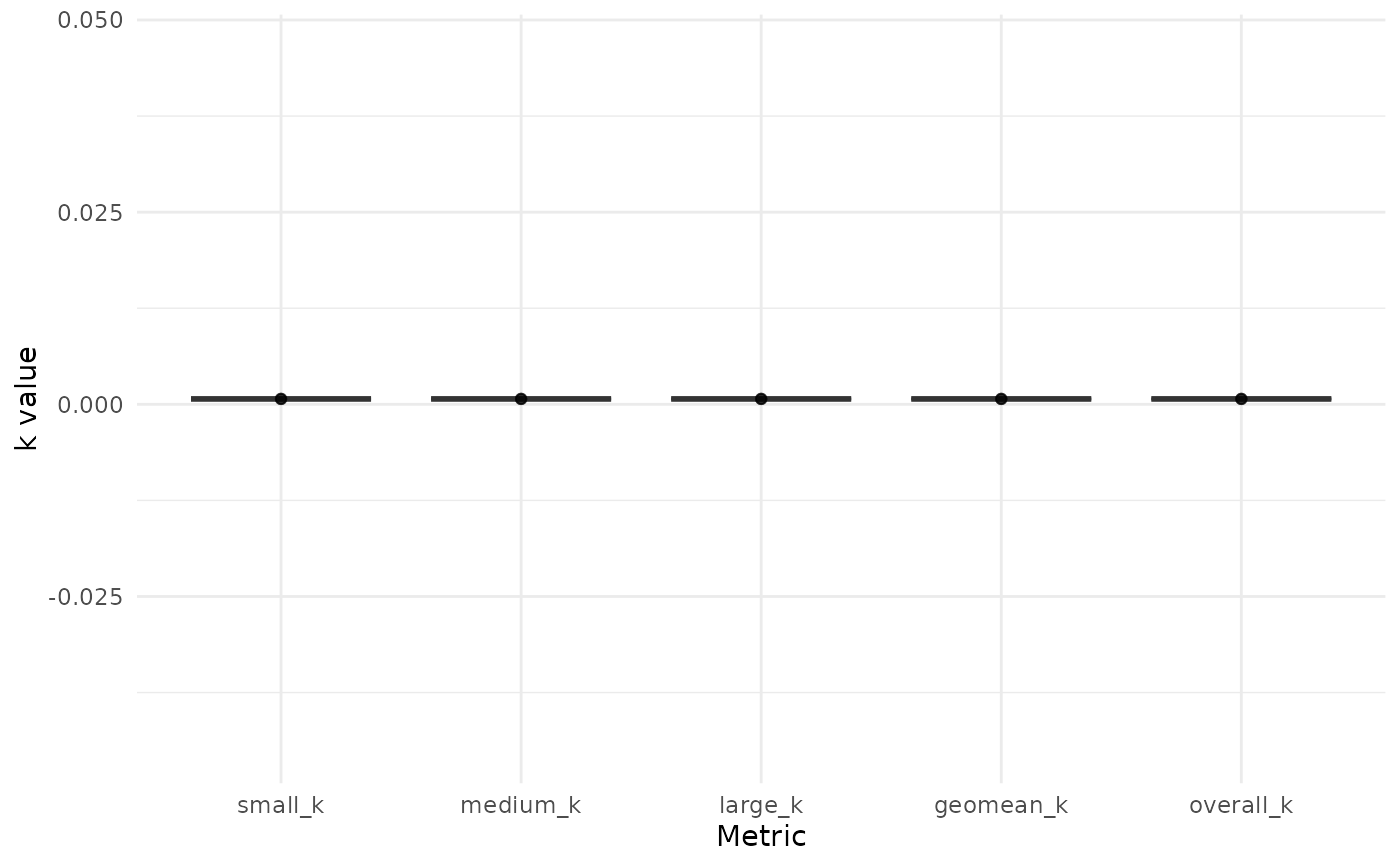
Boxplots the MCQ scores for
different metrics (small_k, medium_k, large_k, geomean_k, overall_k).
Log-transformed k values (trans = "log"/"ln") are detected
and the y-axis label adjusted accordingly.
Usage
# S3 method for class 'score_mcq_output'
plot(x, ..., xlab = "Metric", alpha = 0.3)Examples
dat21 <- data.frame(subjectid = 1:5, questionid = rep(1:21, 5), response = 1)
plot(score_mcq(dat21, items = 21))