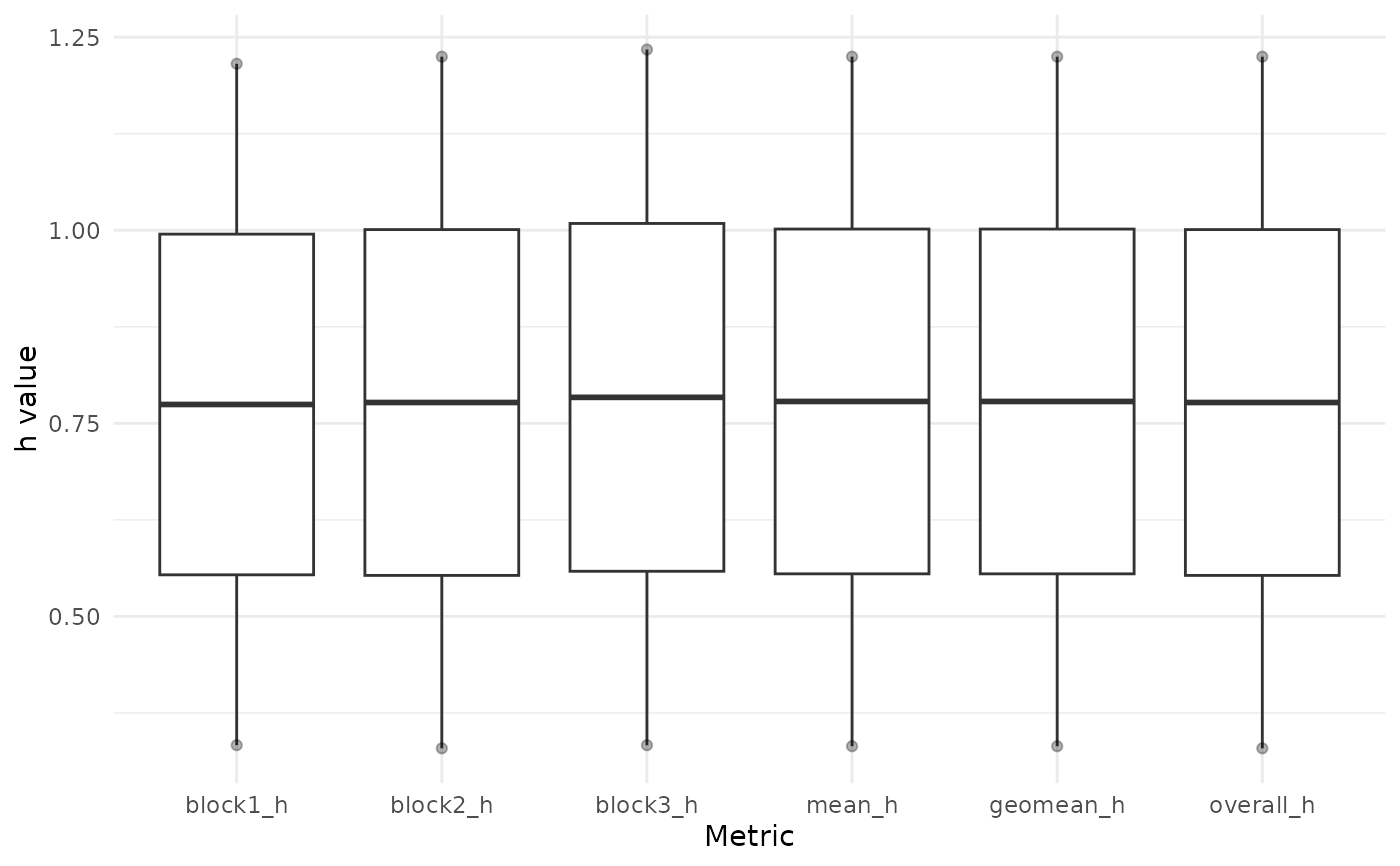
Boxplot of PDQ h metrics (block1_h, block2_h, block3_h, mean_h,
geomean_h, and the pooled overall_h extension), handling the same log
transformations as plot.score_mcq_output().
Usage
# S3 method for class 'score_pdq_output'
plot(x, ..., xlab = "Metric", alpha = 0.3)
Arguments
- x
A data frame returned by the score_pdq function.
- ...
Additional arguments passed to methods.
- xlab
Label for the x-axis. Default is "Metric".
- alpha
Transparency of the points in the plot. Default is 0.3.
Value
A ggplot object showing the boxplot of PDQ scores.