Creates visualizations of fitted demand curves from a hurdle demand model.
Usage
# S3 method for class 'beezdemand_hurdle'
plot(
  x,
  type = c("demand", "population", "probability", "parameters", "individual", "both"),
  ids = NULL,
  subjects = NULL,
  parameters = c("Q0", "alpha", "breakpoint", "Pmax", "Omax"),
  prices = NULL,
  show_population = TRUE,
  show_pred = NULL,
  show_observed = TRUE,
  x_trans = c("log10", "log", "linear", "pseudo_log"),
  y_trans = NULL,
  free_trans = 0.01,
  facet = NULL,
  x_limits = NULL,
  y_limits = NULL,
  x_lab = NULL,
  y_lab = NULL,
  xlab = NULL,
  ylab = NULL,
  style = c("modern", "apa"),
  observed_point_alpha = 0.5,
  observed_point_size = 1.8,
  pop_line_alpha = 0.9,
  pop_line_size = 1,
  ind_line_alpha = 0.35,
  ind_line_size = 0.7,
  ...
)
Arguments
- x
An object of class
beezdemand_hurdle.- type
Character string specifying the plot type:
"demand"Predicted demand curves (default)
"population"Alias for
"demand""probability"Probability of zero consumption
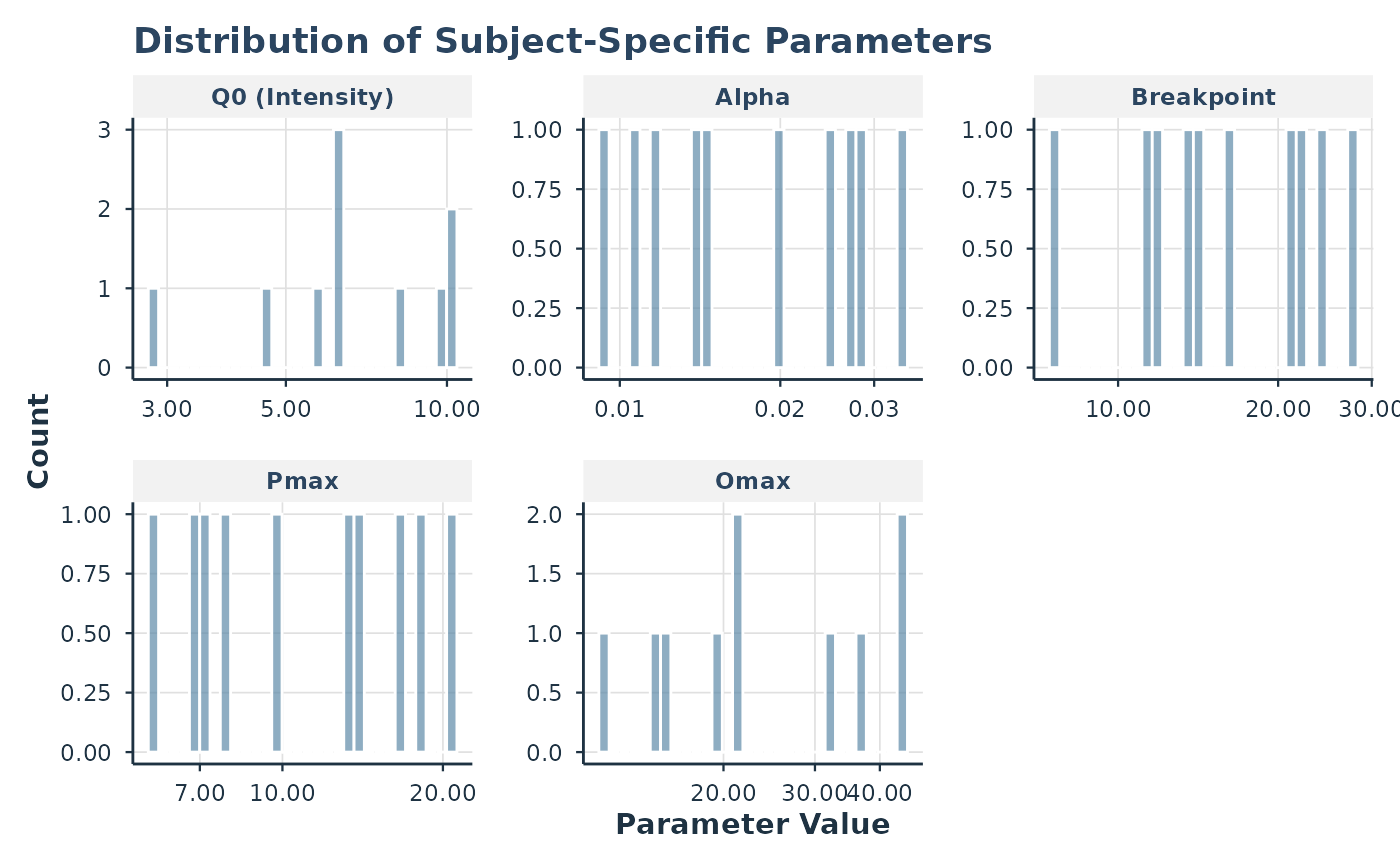
"parameters"Distribution of subject-specific parameters
"individual"Individual demand curves for selected subjects
- ids
Optional vector of subject IDs to plot (alias of
subjects).- subjects
Character or numeric vector of subject IDs to plot for
type = "individual". IfNULL, plots first 9 subjects.- parameters
Character vector specifying which parameters to plot when
type = "parameters". Options are:"Q0","alpha","breakpoint","Pmax","Omax". Default is all five.- prices
Numeric vector of prices for plotting. If
NULL, uses a sequence from 0 to max observed price.- show_population
Logical; if
TRUE, overlay population-level curve on individual plots. Default isTRUE.- show_pred
Which prediction layers to plot: "population", "individual", or "both".
- show_observed
Logical; if
TRUE, overlay observed data points.- x_trans
Character. Transformation for x-axis. Default "log".
- y_trans
Character. Transformation for y-axis. Default "log".
- free_trans
Value used to display free (x = 0) on log scales. Use NULL to drop x <= 0 values instead.
- facet
Faceting specification (TRUE for
~idor a formula).- x_limits
Optional numeric vector of length 2 for x-axis limits.
- y_limits
Optional numeric vector of length 2 for y-axis limits.
- x_lab
Optional x-axis label.
- y_lab
Optional y-axis label.
- xlab
Deprecated alias for
x_lab.- ylab
Deprecated alias for
y_lab.- style
Plot styling, passed to
theme_beezdemand().- observed_point_alpha
Alpha for observed points.
- observed_point_size
Size for observed points.
- pop_line_alpha
Alpha for population curve.
- pop_line_size
Line size for population curve.
- ind_line_alpha
Alpha for individual curves.
- ind_line_size
Line size for individual curves.
- ...
Additional arguments (currently unused).
Examples
# \donttest{
data(apt)
fit <- fit_demand_hurdle(apt, y_var = "y", x_var = "x", id_var = "id")
#> Sample size may be too small for reliable estimation.
#> Subjects: 10, Parameters: 12, Recommended minimum: 60 subjects.
#> Consider using more subjects or the simpler 2-RE model.
#> Fitting HurdleDemand3RE model...
#> Part II: zhao_exponential
#> Subjects: 10, Observations: 160
#> Fixed parameters: 12, Random effects per subject: 3
#> Optimizing...
#> Converged in 81 iterations
#> Computing standard errors...
#> Done. Log-likelihood: 32.81
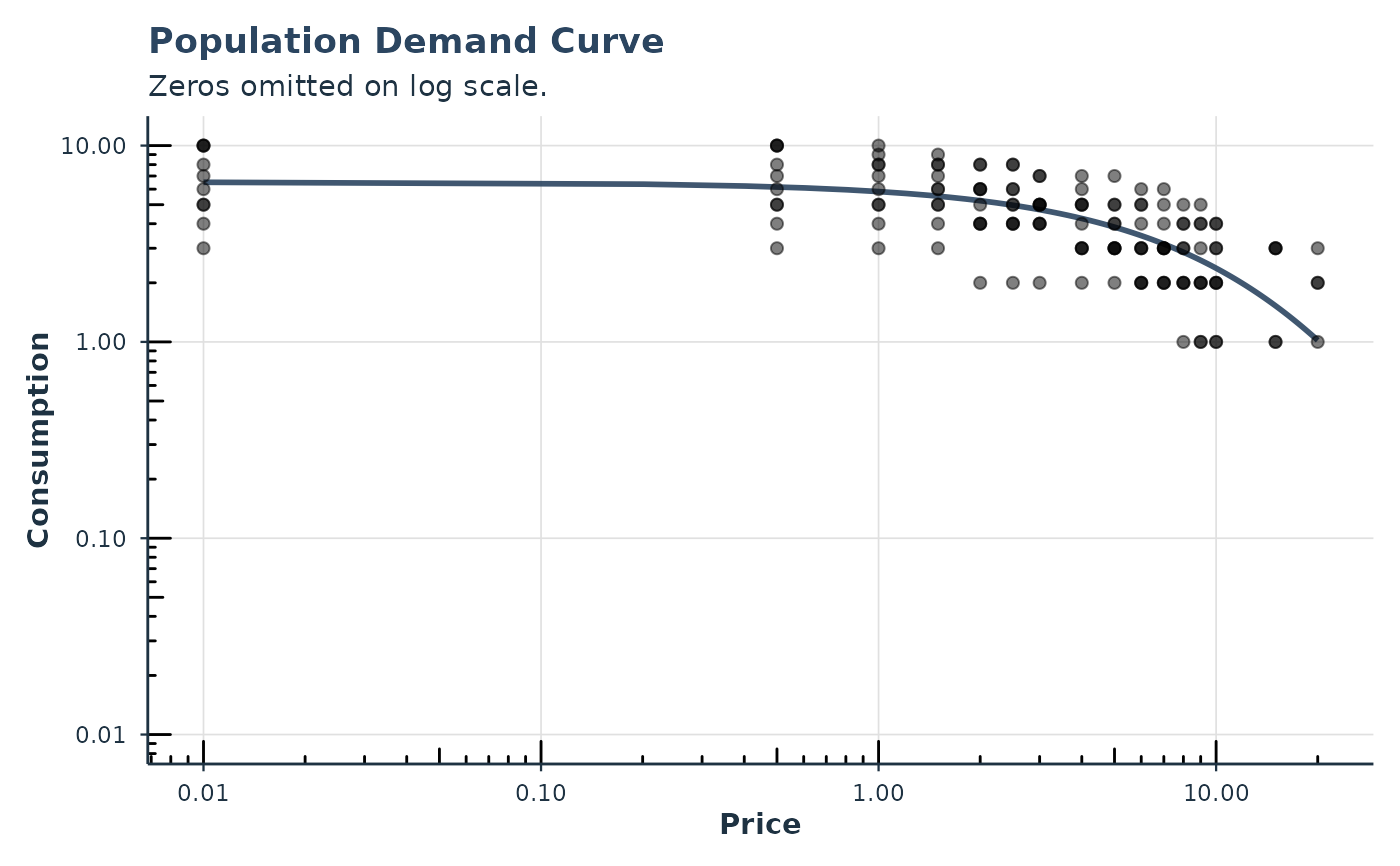
# Plot mean demand curve
plot(fit)
#> Free is shown as `0.01` for purposes of plotting.
 # Plot parameter distributions
plot(fit, type = "parameters")
# Plot parameter distributions
plot(fit, type = "parameters")
 # }
# }