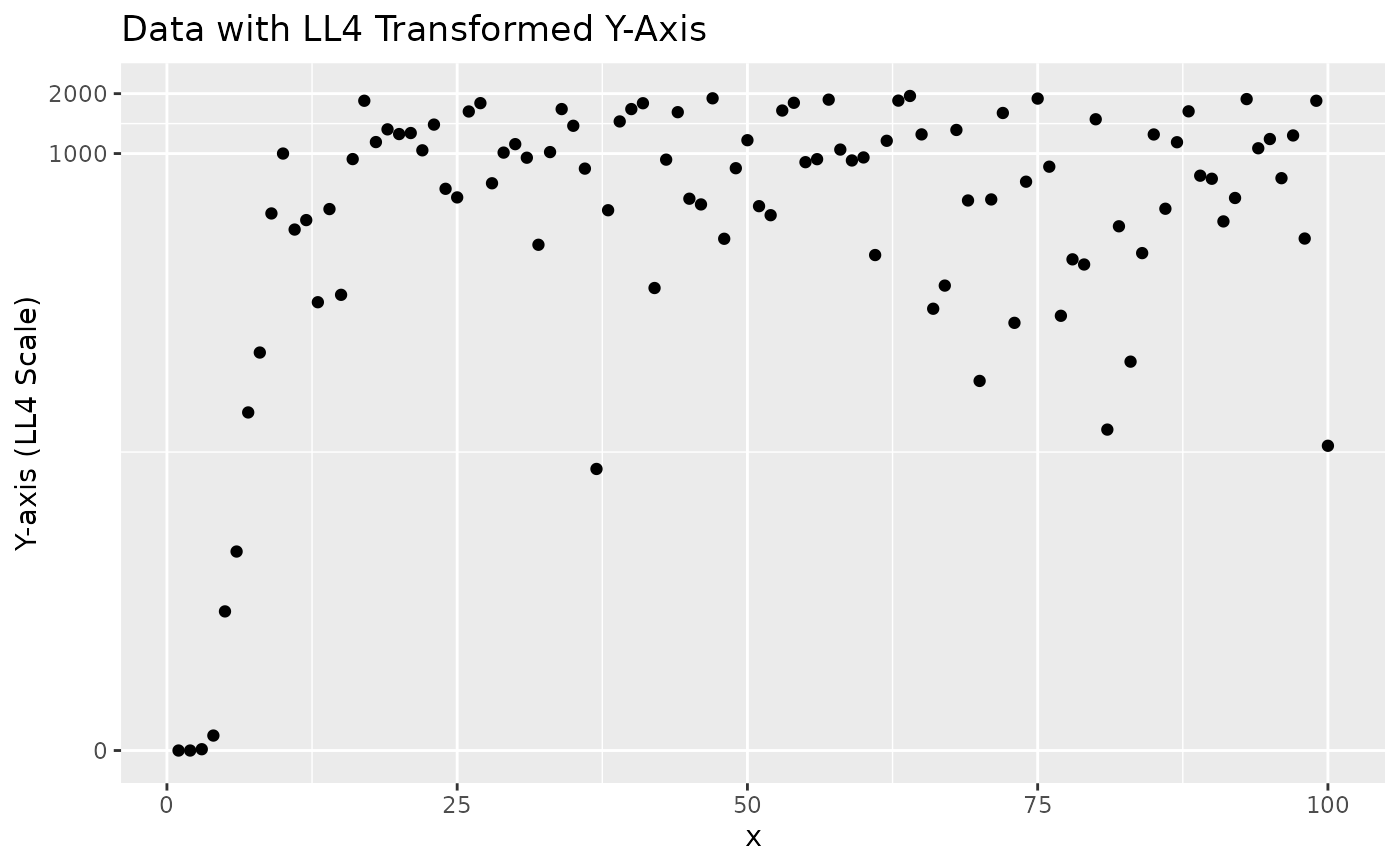
This function generates a ggplot2 continuous scale that applies the ll4
transformation (and its inverse ll4_inv) to an axis. This is useful for
visualizing data spanning multiple orders of magnitude while handling zeros.
Arguments
- ...
Arguments passed on to
ggplot2::scale_y_continuousorggplot2::scale_x_continuous(e.g.,name,breaks,labels).- lambda
A positive numeric scalar, the lambda parameter for the
ll4transformation. Default is4.
Examples
# \donttest{
if (require(ggplot2) && require(scales)) {
  set.seed(123)
  df <- data.frame(
    x = 1:100,
    y_raw = c(0, 0.1, 0.5, 1, 5, 10, 50, 100, 500, 1000, sample(1:2000, 90, replace = TRUE))
  )

  # Plot with y-axis on LL4 scale
  ggplot(df, aes(x = x, y = y_raw)) +
    geom_point() +
    scale_ll4(name = "Y-axis (LL4 Scale)", lambda = 4) +
    ggtitle("Data with LL4 Transformed Y-Axis")

  # Can also be used for x-axis by replacing scale_y_continuous in its definition
  # Or by creating a scale_x_ll4 variant.
}

# }
# }