Calculate Descriptive Statistics by Price
Source:R/descriptive-summary.R
get_descriptive_summary.RdCalculates summary statistics for consumption data at each price point, including measures of central tendency (mean, median), variability (SD), range (min, max), and data quality (proportion of zeros, missing values).
This is the modern replacement for GetDescriptives(), returning a structured
S3 object with dedicated methods for printing, summarizing, and visualizing.
Arguments
- data
A data frame in long format with columns for subject ID, price, and consumption
- x_var
Character string specifying the column name for price (default: "x")
- y_var
Character string specifying the column name for consumption (default: "y")
- id_var
Character string specifying the column name for subject ID (default: "id")
Value
An S3 object of class beezdemand_descriptive containing:
statistics - Data frame with 8 columns (Price, Mean, Median, SD, PropZeros, NAs, Min, Max) and one row per unique price
call - The matched call
data_summary - List with n_subjects, n_prices, and prices vector
Details
For each unique price in the dataset, the function calculates:
Mean - Average consumption across subjects (rounded to 2 decimals)
Median - Median consumption (rounded to 2 decimals)
SD - Standard deviation (rounded to 2 decimals)
PropZeros - Proportion of subjects with zero consumption (0-1)
NAs - Count of missing values
Min - Minimum consumption value (rounded to 2 decimals)
Max - Maximum consumption value (rounded to 2 decimals)
See also
GetDescriptives()- Legacy function (superseded)plot.beezdemand_descriptive()- Visualization methodsummary.beezdemand_descriptive()- Extended summary
Examples
# \donttest{
data(apt, package = "beezdemand")
# Calculate descriptive statistics
desc <- get_descriptive_summary(apt)
print(desc)
#> Descriptive Summary of Demand Data
#> ===================================
#>
#> Call:
#> get_descriptive_summary(data = apt)
#>
#> Data Summary:
#> Subjects: 10
#> Prices analyzed: 16
#>
#> Statistics by Price:
#> Price Mean Median SD PropZeros NAs Min Max
#> 0 6.8 6.5 2.62 0.0 0 3 10
#> 0.5 6.8 6.5 2.62 0.0 0 3 10
#> 1 6.5 6.5 2.27 0.0 0 3 10
#> 1.5 6.1 6.0 1.91 0.0 0 3 9
#> 2 5.3 5.5 1.89 0.0 0 2 8
#> 2.5 5.2 5.0 1.87 0.0 0 2 8
#> 3 4.8 5.0 1.48 0.0 0 2 7
#> 4 4.3 4.5 1.57 0.0 0 2 7
#> 5 3.9 3.5 1.45 0.0 0 2 7
#> 6 3.5 3.0 1.43 0.0 0 2 6
#> 7 3.3 3.0 1.34 0.0 0 2 6
#> 8 2.6 2.5 1.51 0.1 0 0 5
#> 9 2.4 2.0 1.58 0.1 0 0 5
#> 10 2.2 2.0 1.32 0.1 0 0 4
#> 15 1.1 0.5 1.37 0.5 0 0 3
#> 20 0.8 0.0 1.14 0.6 0 0 3
# View statistics table
desc$statistics
#> Price Mean Median SD PropZeros NAs Min Max
#> 1 0 6.8 6.5 2.62 0.0 0 3 10
#> 2 0.5 6.8 6.5 2.62 0.0 0 3 10
#> 3 1 6.5 6.5 2.27 0.0 0 3 10
#> 4 1.5 6.1 6.0 1.91 0.0 0 3 9
#> 5 2 5.3 5.5 1.89 0.0 0 2 8
#> 6 2.5 5.2 5.0 1.87 0.0 0 2 8
#> 7 3 4.8 5.0 1.48 0.0 0 2 7
#> 8 4 4.3 4.5 1.57 0.0 0 2 7
#> 9 5 3.9 3.5 1.45 0.0 0 2 7
#> 10 6 3.5 3.0 1.43 0.0 0 2 6
#> 11 7 3.3 3.0 1.34 0.0 0 2 6
#> 12 8 2.6 2.5 1.51 0.1 0 0 5
#> 13 9 2.4 2.0 1.58 0.1 0 0 5
#> 14 10 2.2 2.0 1.32 0.1 0 0 4
#> 15 15 1.1 0.5 1.37 0.5 0 0 3
#> 16 20 0.8 0.0 1.14 0.6 0 0 3
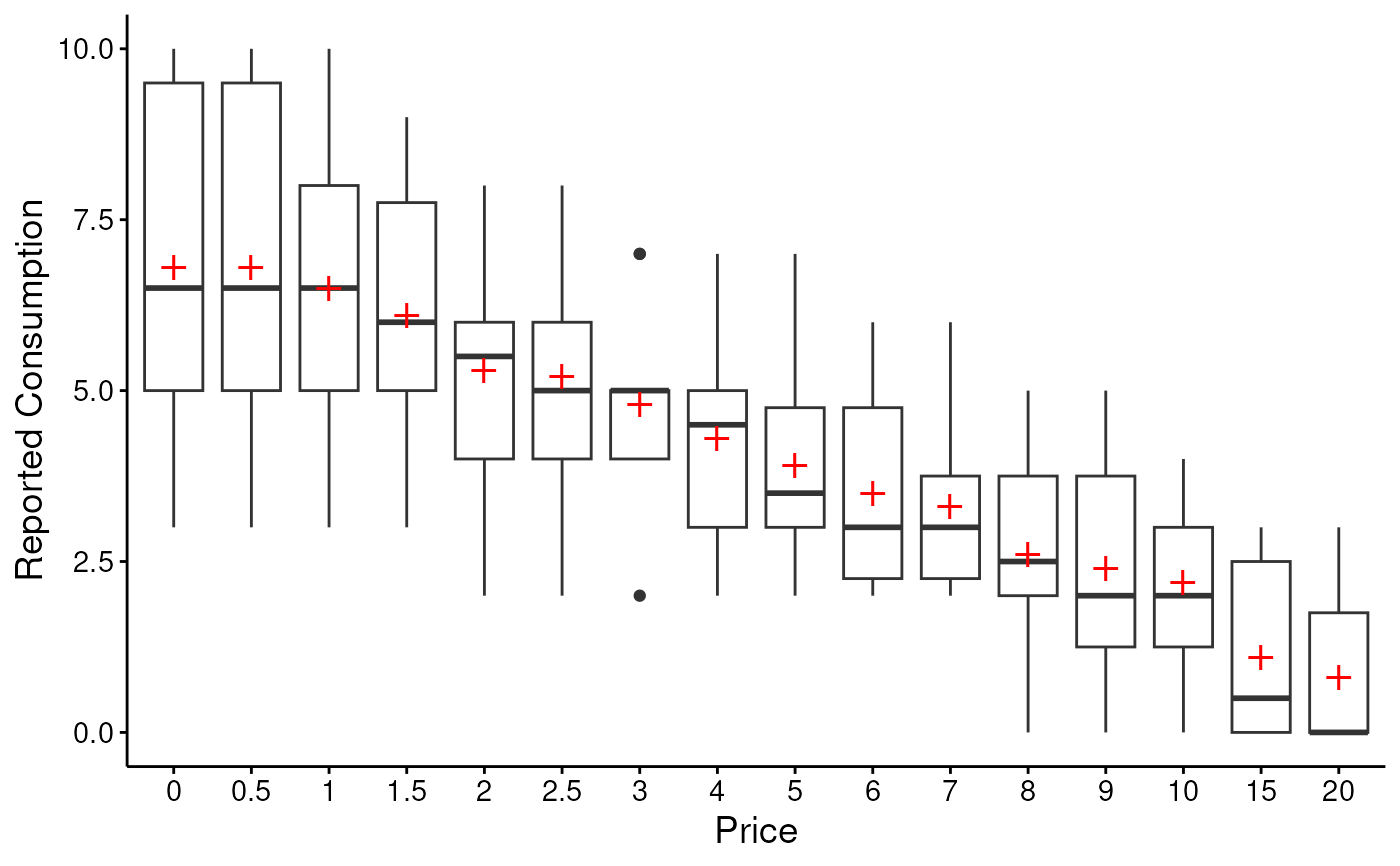
# Create visualization
plot(desc)
 # Extended summary with distribution info
summary(desc)
#> Extended Summary of Descriptive Statistics
#> ==========================================
#>
#> Data Overview:
#> Number of subjects: 10
#> Number of prices: 16
#> Price range: 0 to 9
#>
#> Distribution of Mean Consumption Across Prices:
#> Minimum: 0.80
#> Median: 4.10
#> Maximum: 6.80
#>
#> Proportion of Zeros by Price:
#> Range: 0.00 to 0.60
#>
#> Missing Data:
#> No missing values detected
# }
# Extended summary with distribution info
summary(desc)
#> Extended Summary of Descriptive Statistics
#> ==========================================
#>
#> Data Overview:
#> Number of subjects: 10
#> Number of prices: 16
#> Price range: 0 to 9
#>
#> Distribution of Mean Consumption Across Prices:
#> Minimum: 0.80
#> Median: 4.10
#> Maximum: 6.80
#>
#> Proportion of Zeros by Price:
#> Range: 0.00 to 0.60
#>
#> Missing Data:
#> No missing values detected
# }