
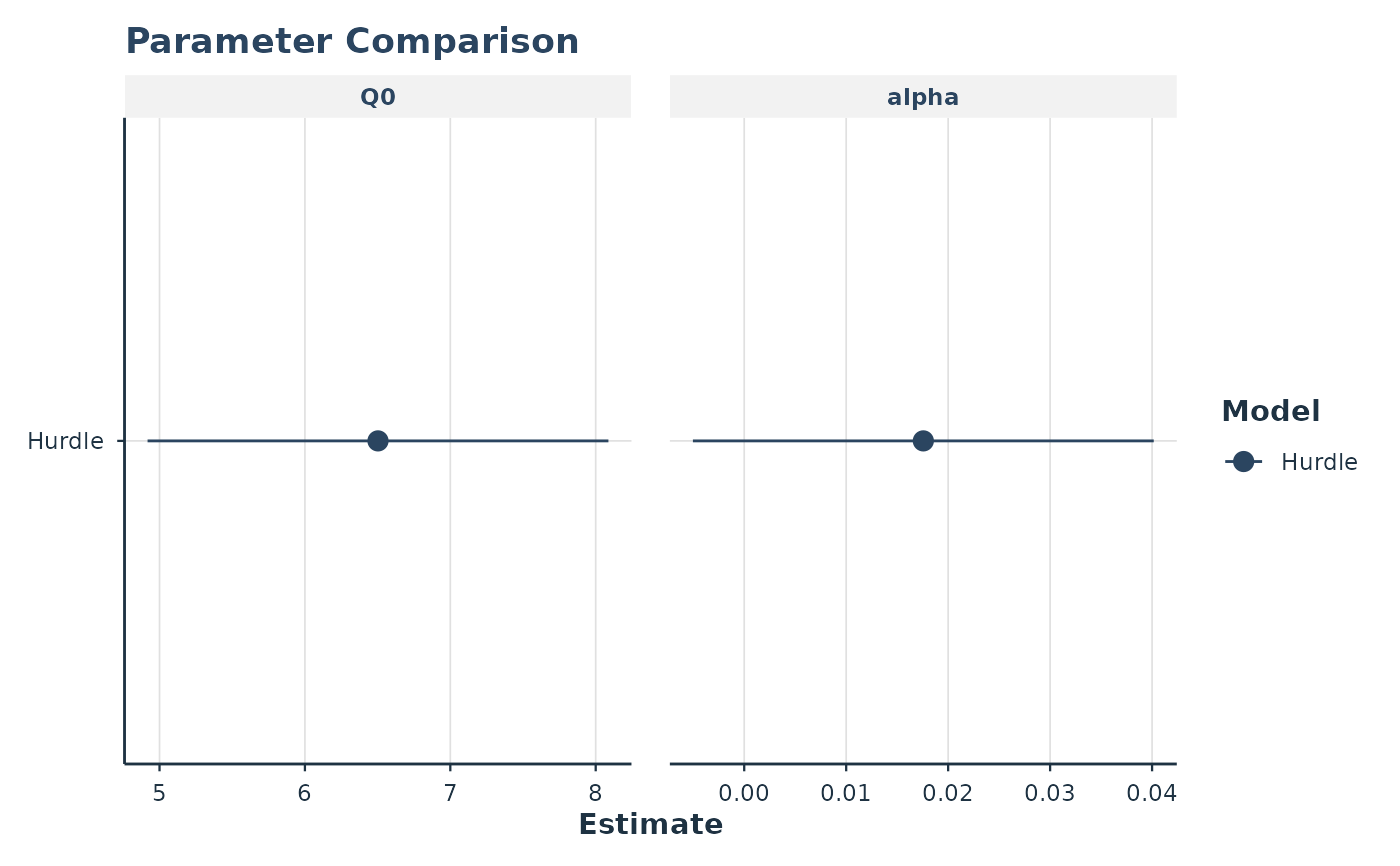
Creates a forest plot (coefficient plot) comparing parameter estimates and confidence intervals across multiple fitted demand models.
Details
Uses tidy() methods to extract parameter estimates and standard errors.
Confidence intervals are computed as estimate +/- z * SE. Parameters are
matched by the term column from tidy() output.
Examples
# \donttest{
data(apt)
fit <- fit_demand_hurdle(apt, y_var = "y", x_var = "x", id_var = "id")
#> Sample size may be too small for reliable estimation.
#> Subjects: 10, Parameters: 12, Recommended minimum: 60 subjects.
#> Consider using more subjects or the simpler 2-RE model.
#> Fitting HurdleDemand3RE model...
#> Part II: zhao_exponential
#> Subjects: 10, Observations: 160
#> Fixed parameters: 12, Random effects per subject: 3
#> Optimizing...
#> Converged in 81 iterations
#> Computing standard errors...
#> Done. Log-likelihood: 32.81
plot_model_comparison(fit, labels = "Hurdle")
 # }
# }