
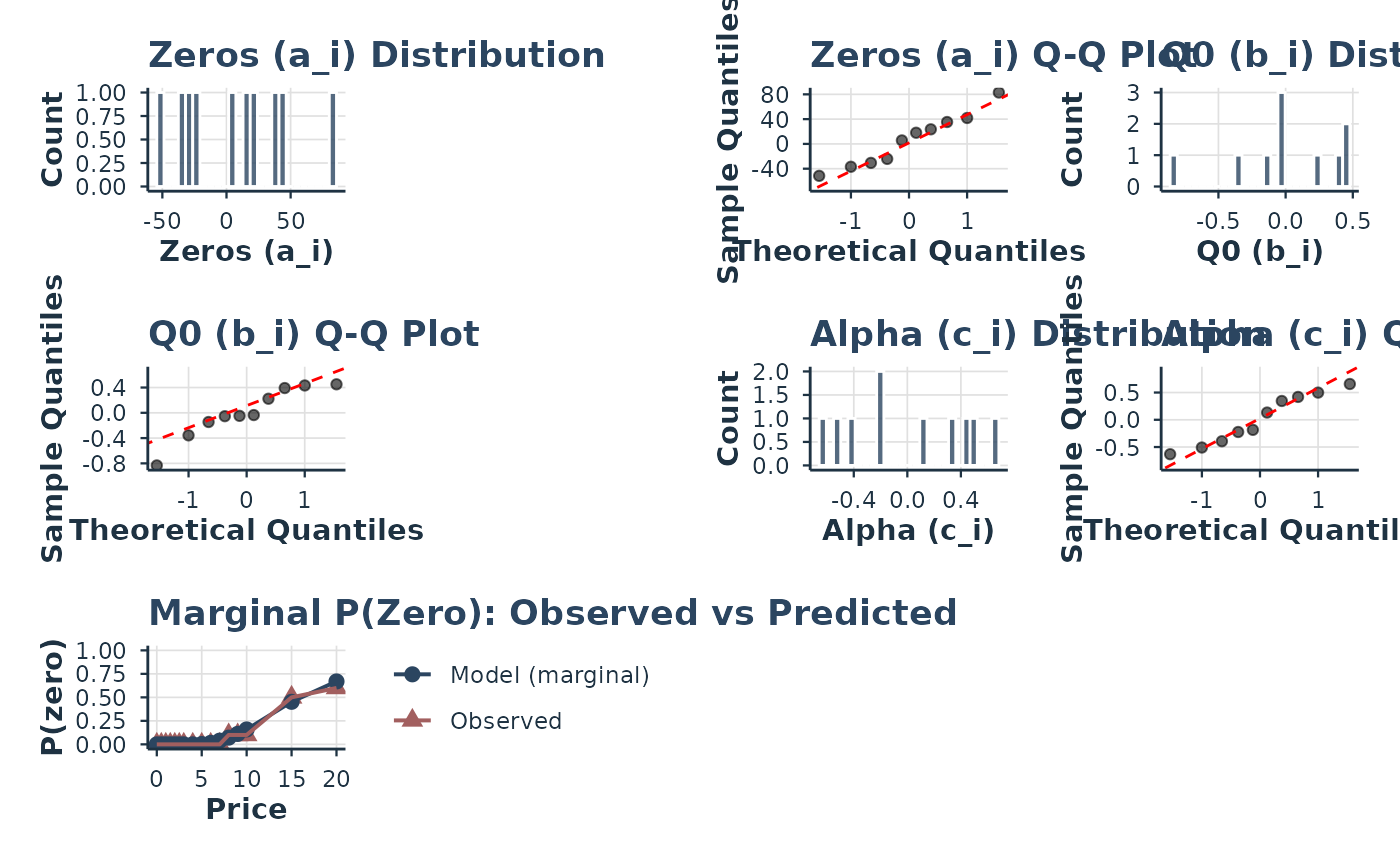
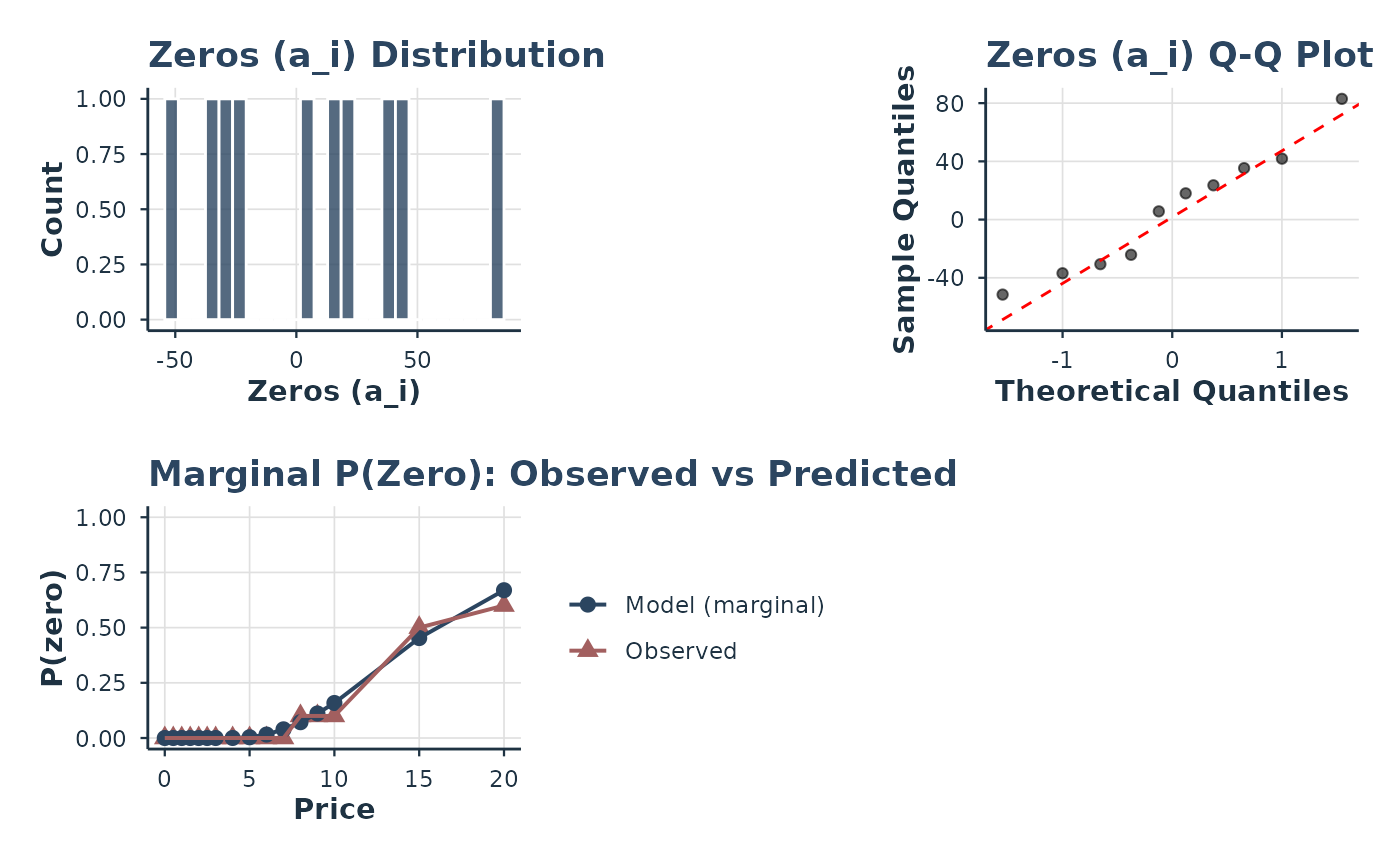
Creates diagnostic panels for random effects: histogram and Q-Q plot for each selected random effect, plus (for the zeros RE) a comparison of observed vs predicted proportion of zeros across prices.
Usage
plot_re_diagnostics(object, ...)

# S3 method for class 'beezdemand_hurdle'
plot_re_diagnostics(
  object,
  which = c("all", "zeros", "q0", "alpha"),
  style = c("modern", "apa"),
  ...
)

# S3 method for class 'beezdemand_tmb'
plot_re_diagnostics(
  object,
  which = c("all", "q0", "alpha"),
  style = c("modern", "apa"),
  ...
)Examples
# \donttest{
data(apt)
fit <- fit_demand_hurdle(apt, y_var = "y", x_var = "x", id_var = "id")
#> Sample size may be too small for reliable estimation.
#> Subjects: 10, Parameters: 12, Recommended minimum: 60 subjects.
#> Consider using more subjects or the simpler 2-RE model.
#> Fitting HurdleDemand3RE model...
#> Part II: zhao_exponential
#> Subjects: 10, Observations: 160
#> Fixed parameters: 12, Random effects per subject: 3
#> Optimizing...
#> Converged in 81 iterations
#> Computing standard errors...
#> Done. Log-likelihood: 32.81
plot_re_diagnostics(fit)
 plot_re_diagnostics(fit, which = "zeros")
 # }
# }