
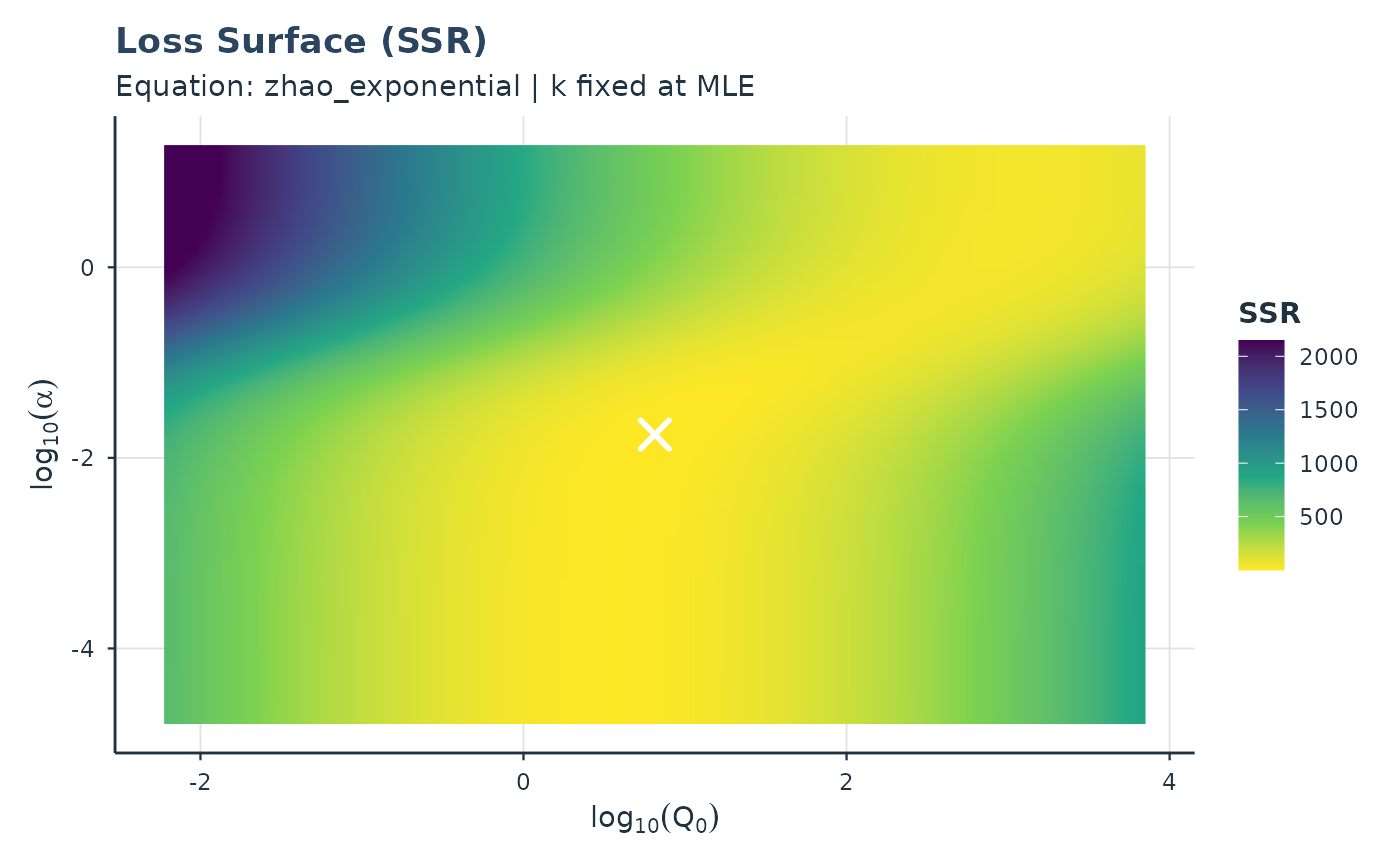
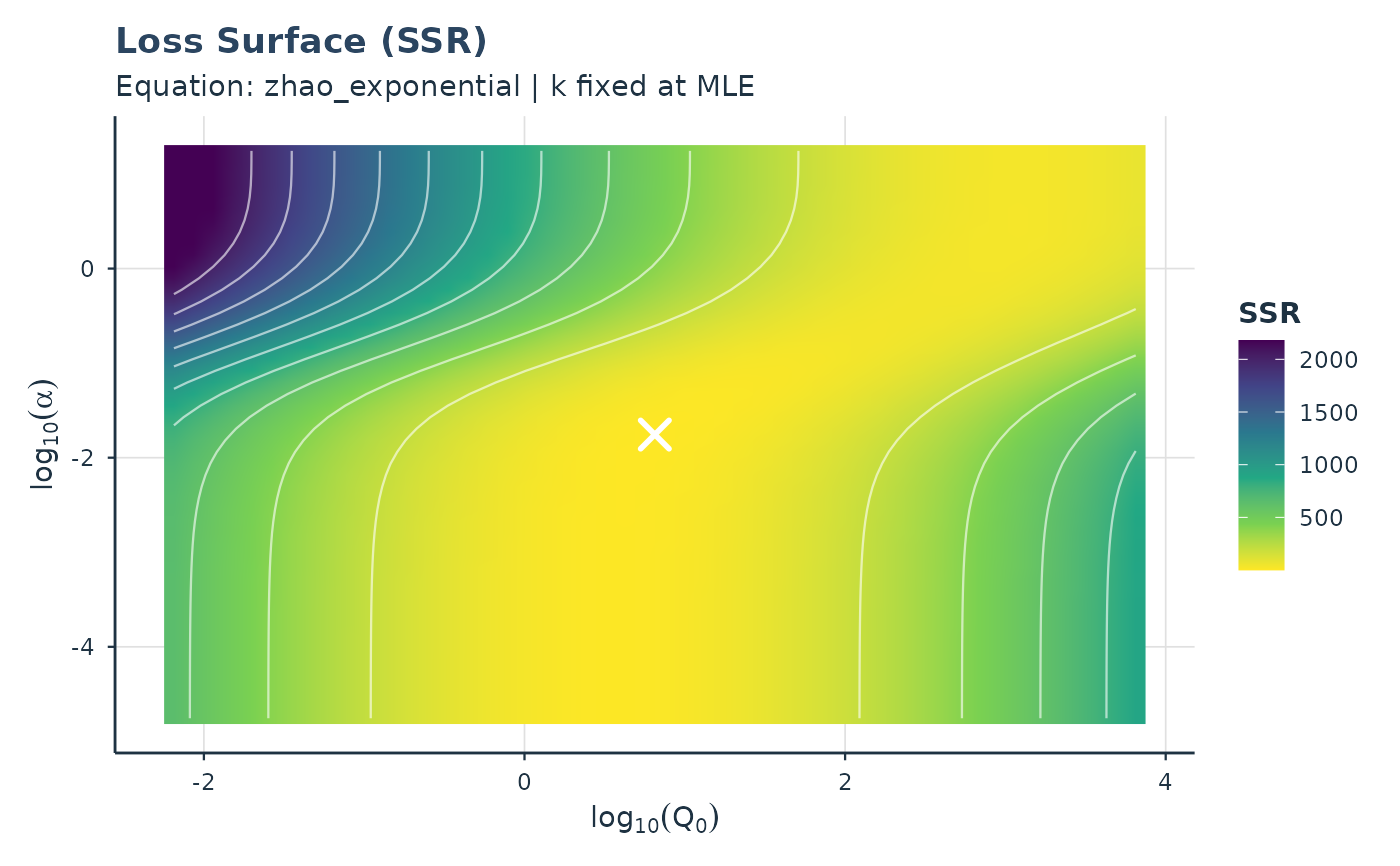
Visualizes the sum-of-squared-residuals (SSR) surface over a grid of Q0 and alpha values, holding other parameters (k, variance components) fixed at their MLE. The SSR is computed on aggregated mean log-consumption by price for the Part II (continuous) component of hurdle models.
Usage
plot_loss_surface(object, ...)

# S3 method for class 'beezdemand_hurdle'
plot_loss_surface(
  object,
  resolution = 80,
  q0_range = NULL,
  alpha_range = NULL,
  fill_palette = "D",
  show_mle = TRUE,
  show_contours = FALSE,
  style = c("modern", "apa"),
  ...
)

# S3 method for class 'beezdemand_tmb'
plot_loss_surface(
  object,
  resolution = 80,
  q0_range = NULL,
  alpha_range = NULL,
  fill_palette = "D",
  show_mle = TRUE,
  show_contours = FALSE,
  style = c("modern", "apa"),
  ...
)

# S3 method for class 'beezdemand_nlme'
plot_loss_surface(
  object,
  resolution = 80,
  q0_range = NULL,
  alpha_range = NULL,
  fill_palette = "D",
  show_mle = TRUE,
  show_contours = FALSE,
  style = c("modern", "apa"),
  type = c("ssr", "marginal"),
  ...
)
Arguments
- object
A fitted model object.
- ...
Additional arguments passed to methods.
- resolution
Integer; grid resolution per axis (default 80).
- q0_range
Numeric vector of length 2; Q0 range (natural scale). Default: MLE +/- 3 orders of magnitude.
- alpha_range
Numeric vector of length 2; alpha range (natural scale). Default: MLE +/- 3 orders of magnitude.
- fill_palette
Character; viridis palette option (default
"D").- show_mle
Logical; overlay MLE point (default
TRUE).- show_contours
Logical; add contour lines (default
FALSE).- style
Character; plot style,
"modern"or"apa".- type
Character; loss surface to plot for NLME models.
"ssr"(default) uses sum-of-squared-residuals on price-aggregated means;"marginal"uses a linearized marginal negative log-likelihood.
Details
Note that this function computes SSR on price-aggregated means rather than a true profile likelihood. The resulting surface shows how well different (Q0, alpha) pairs explain the average demand pattern, but does not account for individual variation. For models with large random effects, the surface may appear sharper than the full-data objective.
Supported model classes: beezdemand_hurdle, beezdemand_tmb, and
beezdemand_nlme. Models with factor covariates on Q0 or alpha are not
supported; use get_demand_param_emms() instead.
See also
plot_loss_profile() for 1D profile slices
Examples
# \donttest{
data(apt)
fit <- fit_demand_hurdle(apt, y_var = "y", x_var = "x", id_var = "id")
#> Sample size may be too small for reliable estimation.
#> Subjects: 10, Parameters: 12, Recommended minimum: 60 subjects.
#> Consider using more subjects or the simpler 2-RE model.
#> Fitting HurdleDemand3RE model...
#> Part II: zhao_exponential
#> Subjects: 10, Observations: 160
#> Fixed parameters: 12, Random effects per subject: 3
#> Optimizing...
#> Converged in 81 iterations
#> Computing standard errors...
#> Done. Log-likelihood: 32.81
plot_loss_surface(fit)
 plot_loss_surface(fit, resolution = 50, show_contours = TRUE)
#> Warning: The following aesthetics were dropped during statistical transformation: fill.
#> ℹ This can happen when ggplot fails to infer the correct grouping structure in
#> the data.
#> ℹ Did you forget to specify a `group` aesthetic or to convert a numerical
#> variable into a factor?
plot_loss_surface(fit, resolution = 50, show_contours = TRUE)
#> Warning: The following aesthetics were dropped during statistical transformation: fill.
#> ℹ This can happen when ggplot fails to infer the correct grouping structure in
#> the data.
#> ℹ Did you forget to specify a `group` aesthetic or to convert a numerical
#> variable into a factor?
 # }
# }